- POPULAR POSTS
-
- A Better Solution to Hourly Billing Practices: Radical Real-Time Hourly Fee Billing
- Living Trusts are All About Avoiding Men in Black Robes
- Shame Shame Shame on the Estate Planning Industries -- and Me Possibly Lending a Helping Hand
- Couples and Financial Planning: Of Communication Flows and Gender-Neutrality
- Towards an Industry of Pure Financial Advice
- Not all debt is bad debt
- Death and Dying, and Two Tears
- Using the California Statutory Will
- When You Get Financial Advice for Free, are You the Product?
- Tommy Lee Jones, Ameriprise and the Double-Deal
- PAST POSTS
-
- March 2020
- June 2019
- January 2017
- July 2015
- February 2015
- January 2015
- December 2014
- September 2014
- July 2014
- June 2014
- May 2014
- April 2014
- March 2014
- February 2014
- January 2014
- December 2013
- November 2013
- October 2013
- September 2013
- August 2013
- July 2013
- June 2013
- May 2013
- April 2013
- March 2013
- February 2013
- January 2013
- December 2012
- November 2012
- October 2012
- September 2012
- August 2012
- July 2012
- February 2012
- October 2011
- August 2011
- October 2010
- July 2010
- June 2010
- January 2010
- June 2009
- January 2009
- January 2008
- January 2007
- September 2006
- May 2006
- February 2006
- January 2006
- November 2004
- CATEGORIES
-
- The Big Picture (44)
- The Financial Services Industrial Complex (43)
- The Financial World Out There (38)
- Investing (35)
- Politics (27)
- Being Smart (23)
- Fun with Numbers (22)
- The Big Us (20)
- Elder Years (17)
- The Ways of the World (13)
- Non-Numeric Financial Health (13)
- The Wonder of It All (12)
- Retirement Planning (11)
- Taxes (11)
- Business (11)
- Financial Jargon/Financial Language (11)
- Being Human (11)
- Financial Planning (10)
- The Financial Self Within Us (10)
- Retirement Accounts (10)
- Overall Financial Health (10)
- Insurance (10)
- The Medical Services Industrial Complex (10)
- Uncategorized (9)
- Balance Sheet Design (9)
- Spending (8)
- Debt (8)
- Friedman's Law of the First Thing (8)
- Numeric Financial Health (8)
- Top 10 List (7)
- Savings (7)
- Financial Advisors (7)
- Mortgages (6)
- Estate Planning (6)
- JFF Self-Reflection (6)
- Pure Financial Advice (6)
- What's Important About Money (5)
- Real Estate (5)
- Privacy (5)
- Building Your Financial Brain Trust (4)
- JF Self-Reflection (3)
- Online Safety (3)
- Technology (3)
- Making a Living (3)
- Scale Tales (3)
- Working for a Living (3)
- Lifestyle Decision-Making (3)
- MBAisms (3)
- Education Accounts (3)
- Money-Stored (2)
- Fun (2)
- Your Financial Personality (2)
- Financial Writing (2)
- Cashflowing (2)
- Money-In/Money-Out (2)
- Interest Rates (1)
- The Insurance Services Industrial Complex (1)
- The Legal Services Industrial Complex (1)
- Healthcare (1)
- Business of Financial Planning (1)
- Heathcare (1)
- Financial Ops (1)
- Friedman's Law of the 1st Thing (1)
- Children (1)
- Time Off from Blogging (1)
- Financial Wonkery (1)
- Couples (1)
- TAGS
-
- AUM fees (13)
- Microsoft (10)
- Dave Ramsey (10)
- Apple (9)
- Facebook (9)
- Rorschach Test (9)
- Paul Krugman (9)
- NFs (9)
- Normal Folks (9)
- George W. Bush (8)
- Mitt Romney (8)
- FSIC (7)
- WAITT (7)
- MSFT (6)
- FRED (6)
- Google (6)
- E*Trade (5)
- Excel (5)
- luck (5)
- iPhone (5)
- Ronald Reagan (5)
- IPO (5)
- Twitter (5)
- Medicare (5)
- YOYO (5)
- SFCA (5)
- Wall Street (5)
- The Fiscal Cliff (5)
- Vanguard (5)
- Ess Eff Sea Eh (5)
- Social Security (5)
- BofA (5)
- Wells (5)
- Citi (5)
- Chase (5)
- Paul McCartney (5)
- vig (5)
- death (4)
- Steve Jobs (4)
- AAPL (4)
- SCOTUS (4)
- macroeconomics (4)
- Schwab (4)
- GDP (4)
- eBay (4)
- Alan Greenspan (4)
- family (4)
- ObamaCare (4)
- George Harrison (4)
- Bill Clinton (4)
- Barack Obama (4)
- life insurance (4)
- index funds (4)
- 401k plans (4)
- John Lennon (3)
- money-in (3)
- GE (3)
- Komen (3)
- phishing (3)
- money-out (3)
- predictions (3)
- Osama bin Laden (3)
- The New Yorker (3)
- basis points (3)
- SEC (3)
- FB (3)
- Dems (3)
- Repubs (3)
- Paul Ryan (3)
- Yahoo Finance (3)
- Lehman (3)
- Groupon (3)
- mutual funds (3)
- Nate Silver (3)
- Noe Valley (3)
- Zynga (3)
- EOB (3)
- The Beatles (3)
- dentists (3)
- Medicaid (3)
- FSPs (3)
- FWoJT (3)
- Kafkaesque (3)
- commissions (3)
- TANSTAAFL (3)
- Warren Zevon (3)
- California (3)
- lawyers (3)
- Michael Kitces (3)
- BPs (3)
- Fandango (2)
- investing (2)
- BP (2)
- hockey players (2)
- General Electric (2)
- big numbers (2)
- righteous death (2)
- entropy (2)
- HP12C (2)
- PMT (2)
- savings rate (2)
- credit cards (2)
- dementors (2)
- Harry Potter (2)
- inflation (2)
- Krugman (2)
- lefties (2)
- righties (2)
- Ritholtz (2)
- The Big Us (2)
- VTI (2)
- scam (2)
- money-stored (2)
- NINY (2)
- gold (2)
- guns (2)
- writing long (2)
- bankruptcy (2)
- nuance (2)
- Proctor & Gamble (2)
- Interest rates (2)
- financial-speak (2)
- COBRA (2)
- Barry Ritholtz (2)
- The Red Queen (2)
- Vice Versa Rule (2)
- Al Pacino (2)
- PPACA (2)
- Netflix (2)
- James Bond (2)
- Mr. Softee (2)
- Todd Akin (2)
- austerity (2)
- AIG (2)
- Bank of America (2)
- Powers that Be (2)
- Game Theory (2)
- Blackberry (2)
- Bain Capital (2)
- Bad Astronomy (2)
- LinkedIn (2)
- New York Times (2)
- Mia Bella (2)
- Eric Idle (2)
- Iraq (2)
- urban infill (2)
- Market Street (2)
- income tax (2)
- dividends (2)
- capital gains (2)
- science (2)
- math (2)
- Ess Eff CA (2)
- HIPAA (2)
- Ironic (2)
- Sgt. Peppers (2)
- money managers (2)
- auto-ding (2)
- IAPD (2)
- George Lakoff (2)
- Frank Lutz (2)
- Dan Hicks (2)
- POTS (2)
- voting (2)
- Bush v. Gore (2)
- Procol Harum (2)
- Grover Norquist (2)
- Cass Sunstein (2)
- The Left (2)
- UHNWs (2)
- HNWs (2)
- Ameriprise (2)
- Fidelity (2)
- Michael Pollan (2)
- human nature (2)
- Talking Heads (2)
- MoneyChimp (2)
- eyeballability (2)
- eyeballable (2)
- Phil Plait (2)
- asset-gathering (2)
- active investing (2)
- Abraham Lincoln (2)
- fun (2)
- FPers (2)
- Meg Whitman (2)
- James Baker III (2)
- Bette Midler (2)
- Chicago (2)
- BLBHBs (2)
- Roth accounts (2)
- CAGR (2)
- IRS (2)
- PITB (2)
- simplicity (2)
- TDAs (2)
- TPAs (2)
- IRAs (2)
- 403b plans (2)
- HSAs (2)
- Ringo Starr (2)
- Johnny Cash (2)
- CPAs (2)
- Congress (2)
- free lunch (2)
- Baby Boomers (2)
- Clint Eastwood (2)
- monthly nut (2)
- oh the humanity (2)
- Monty Python (2)
- Federal Reserve (2)
- George Costanza (2)
- Top 10 List (2)
- who gets what (2)
- David Letterman (2)
- Malcolm Gladwell (2)
- Star Trek (2)
- yay (2)
- Goldilocksian (2)
- doctors (2)
- Dire Straits (2)
- Seinfeld (2)
- Soup Nazi (2)
- Quicken (2)
- pricing (2)
- Ess Eff Sea Ay (2)
- estate planning (2)
- estate tax (2)
- revenue models (2)
- Mosaic 1.0 (2)
- Internet Bubble (2)
- standard of care (2)
- respite (2)
- hospice (2)
- love (2)
- San Francisco (2)
- leverage (2)
- Mid-Market (2)
- Rule of 72 (2)
- Silicon Valley (2)
- InsCo (2)
- rules of thumb (2)
- DOL (2)
- exceptionalism (2)
- ISIC (2)
- MSIC (2)
- AARP (2)
- cause of death (2)
- dying (2)
- Howard Baker (1)
- maximization (1)
- honesty (1)
- got’ch’ya (1)
- RVW’ed money (1)
- RVW (1)
- Rip Van Winkle (1)
- banks (1)
- asset gatherers (1)
- index investing (1)
- Hindenburg (1)
- homebuyers (1)
- fish (1)
- domain (1)
- 529 accounts (1)
- TUFFF (1)
- portfolio (1)
- investments (1)
- Heisenberg (1)
- Einstein (1)
- Marx (1)
- lefty (1)
- dialectic (1)
- 9/11 (1)
- blogging (1)
- sinkhole (1)
- LIBOR (1)
- quadrillion (1)
- Aaron Sorkin (1)
- Central Casting (1)
- Olympics (1)
- Malcom Gladwell (1)
- rent vs. own (1)
- charity (1)
- giving (1)
- the cut-off (1)
- mortgage brokers (1)
- mortgages (1)
- NPV (1)
- PV (1)
- security (1)
- craigslist (1)
- unemployed (1)
- underemployed (1)
- Bill Janklow (1)
- devil numbers (1)
- South Dakota (1)
- usury (1)
- Walter Wriston (1)
- ZTABS (1)
- aggregate demand (1)
- empathy (1)
- Kedrosky (1)
- unemployment (1)
- fungible (1)
- magical dollars (1)
- simplification (1)
- scammers (1)
- vigilance (1)
- Webloyalty (1)
- fee income (1)
- George Bailey (1)
- spread income (1)
- probabilities (1)
- probabilty cloud (1)
- portfolio design (1)
- SFO (1)
- NFP (1)
- righty (1)
- wordcount (1)
- General Motors (1)
- GM (1)
- growth stocks (1)
- value stocks (1)
- Goldman (1)
- Louis Rukeyser (1)
- forecasts (1)
- survivalism (1)
- loyalty (1)
- Donald Trump (1)
- alignment (1)
- transparency (1)
- United Airlines (1)
- LUV (1)
- UAL (1)
- Kafka (1)
- Catch-22 (1)
- Suze Orman (1)
- student loans (1)
- credit card debt (1)
- multi-tasking (1)
- entrepreneurs (1)
- P&G (1)
- NPR (1)
- architecture (1)
- al Qaeda (1)
- annuities (1)
- fiduciaries (1)
- TravelZoo (1)
- portability (1)
- POPS (1)
- RQ (1)
- Inside Baseball (1)
- FINRA (1)
- SRO (1)
- opthomology (1)
- optometry (1)
- brokerages (1)
- Alfred Kahn (1)
- SkyNet (1)
- mock-up-able (1)
- un-mock-up-able (1)
- wisdom (1)
- physical health (1)
- aging (1)
- life's journey (1)
- Kinight Capital (1)
- big things (1)
- Zuckerberg (1)
- fail (1)
- BLS (1)
- Meteor Blades (1)
- job creation (1)
- U3 (1)
- politics (1)
- QnDGA Series (1)
- cashflow pump (1)
- Ezra Klein (1)
- Sarah Kliff (1)
- $716 Billion (1)
- 60 Minutes (1)
- WonkBlog (1)
- CBO (1)
- ACA (1)
- Nancy Brinker (1)
- New Coke (1)
- Tylenol (1)
- Tiger Woods (1)
- pink ribbons (1)
- CharityWatch (1)
- eleemosynary (1)
- I See You (1)
- Na'vi (1)
- Avatar (1)
- Pandora (1)
- Mr. Peabody (1)
- Wayback Machine (1)
- MUNI (1)
- John Schnatter (1)
- healthcare (1)
- EssEffSeeEh (1)
- Neil Cavuto (1)
- 10-to-1 (1)
- tautology (1)
- The JFF Blog (1)
- iPod (1)
- Forbes (1)
- Kurt Eichenwald (1)
- Vanity Fair (1)
- Charlie Rose (1)
- revenues (1)
- revs (1)
- Timothy Worstall (1)
- Netscape (1)
- mafia (1)
- Henry Blodget (1)
- EPI (1)
- OECD (1)
- Lawrence Kudlow (1)
- FSMC (1)
- Chile (1)
- Mexico (1)
- Turkey (1)
- U.S.A. (1)
- iOS (1)
- Ramussen (1)
- the NAZ (1)
- Grace SLick (1)
- Matt Ridley (1)
- Texas Hold 'Em (1)
- JFRQ Consulting (1)
- spoonerism (1)
- Archie Bunker (1)
- IPS (1)
- fractals (1)
- chaos theory (1)
- Bolinas (1)
- Bodega (1)
- Drake''e Estero (1)
- Point Reyes (1)
- Abbots Lagoon (1)
- Drakes Bay (1)
- Google maps (1)
- S&P downgrade (1)
- zoom level (1)
- Recession (1)
- JFRQ group email (1)
- US Airways (1)
- Firefox (1)
- Merrill (1)
- Reserve Fund (1)
- repos (1)
- commercial paper (1)
- Fannie Mae (1)
- Freddie Mac (1)
- P2B (1)
- Annie Lowrey (1)
- OWS (1)
- The 99% (1)
- The 1% (1)
- The 47% (1)
- % (1)
- Peggy Noonan (1)
- Jack Welch (1)
- repeat play (1)
- single play (1)
- financiers (1)
- business people (1)
- hover function (1)
- iWhatever (1)
- iPad (1)
- iTouch (1)
- Thunderbird (1)
- Mail (1)
- I Want My HDTV (1)
- HDTV (1)
- I Want My MTV (1)
- collectivism (1)
- Bad Astronoer (1)
- Phill Plait (1)
- Mars (1)
- the Moon (1)
- Bas Lansdorp (1)
- Alice Kramden (1)
- scarcity (1)
- Stop It! (1)
- ROI (1)
- Elon Musk (1)
- market cap (1)
- Intel (1)
- Trulia (1)
- LNKD (1)
- ETFs (1)
- RAND (1)
- Ralph Fielding (1)
- Votamatic (1)
- Intrade (1)
- Ireland (1)
- Billy Bean (1)
- Grinnell College (1)
- Psych 101 (1)
- Wile E. Coyote (1)
- Dick Cheney (1)
- Liz Cheney (1)
- Ron Suskind (1)
- prism glasses (1)
- happiness (1)
- Daniel Gilbert (1)
- David Cameron (1)
- Iraq are (1)
- Jax (1)
- Peg Bundy (1)
- Sons of Anarchy (1)
- SOA (1)
- Midwest trees (1)
- SFMOMA (1)
- Bay Bridge (1)
- Genentch (1)
- Dumbarton Bridge (1)
- PayPal (1)
- Loma Prieta (1)
- Nat King Cole (1)
- Impact Investing (1)
- II (1)
- Ida James (1)
- SRI (1)
- Kiva (1)
- micro-lending (1)
- Big Philanth (1)
- nineteen for me (1)
- Taxman (1)
- Tax Foundation (1)
- interest (1)
- Wesley Snipes (1)
- John Branca (1)
- Esalen Institute (1)
- Pacific Grove CA (1)
- Carmel CA (1)
- fun-ster (1)
- The Tenderloin (1)
- Lovers Point (1)
- Lighthouse Ave. (1)
- Big Sur (1)
- Tom Rush (1)
- Driving Wheel (1)
- Paul Broun (1)
- Burj Khalifa (1)
- Burj Dubai (1)
- speed of light (1)
- biology (1)
- chemistry (1)
- Donna Summer (1)
- On the Radio (1)
- mortgage (1)
- refi (1)
- wash (1)
- escrow (1)
- title insurance (1)
- bragging rights (1)
- big-fish stories (1)
- escrow fees (1)
- tax expenditures (1)
- mortgage broker (1)
- eyeballing (1)
- CNA (1)
- federal deficit (1)
- negative numbers (1)
- fractions (1)
- exponents (1)
- Murgatroyd (1)
- GOOG (1)
- HFT (1)
- 10K (1)
- 10Q (1)
- doing the zeros (1)
- Black Friday (1)
- Flash Crash (1)
- MMs (1)
- Brochure (1)
- The Item Fives (1)
- infaation (1)
- Into the Wild (1)
- x-bike (1)
- PnP (1)
- EssEff CA (1)
- stock brokers (1)
- Fox Business (1)
- Republicans (1)
- Democrats (1)
- Jim Carville (1)
- GHW Bush (1)
- Larry Doyle (1)
- Matt Egan (1)
- voting lines (1)
- NSPOTS (1)
- NSPOTSWIT! (1)
- Three 9s (1)
- embarrassment (1)
- iTubes (1)
- Ted Stevens (1)
- tubes (1)
- mobile phones (1)
- big machines (1)
- sunflower (1)
- Fibonacci (1)
- Christine Romer (1)
- tax rates (1)
- NBush v. Gore (1)
- John Kerry (1)
- Wile'y Coyote (1)
- Roadrunner (1)
- 1031 exchanges (1)
- bonds (1)
- tax-ugly (1)
- tax-beautiful (1)
- tax-deferred (1)
- Treasurys (1)
- sausage-making (1)
- CGs (1)
- ASAP (1)
- Halloween (1)
- Thanksgiving (1)
- 1040-tweaking (1)
- Gary Brooker (1)
- Proposition 13 (1)
- defense spending (1)
- nudges (1)
- Richard Thaler (1)
- The Right (1)
- The New Deal (1)
- Mother Jones (1)
- The Aughts (1)
- The Teens (1)
- Naughty Aughties (1)
- Proposition 30 (1)
- Robert Reich (1)
- the s-c s-c FC (1)
- generic advice (1)
- Uranium 235 (1)
- Uranium 238 (1)
- Tommy Lee Jones (1)
- Batman (1)
- High Net Worth (1)
- Steven Segal (1)
- Kate Blanchett (1)
- Missing (1)
- fiduciary duties (1)
- fiduciary (1)
- double-dealing (1)
- Under Siege (1)
- UHS (1)
- crevice (1)
- crevasse (1)
- Hostess (1)
- Twinkies (1)
- Hostess Cupcakes (1)
- Motorola (1)
- Jim Collins (1)
- Built to Last (1)
- RIM (1)
- dodo bird (1)
- Nutraceutical (1)
- Real Foods (1)
- David Byrne (1)
- Ding Dongs (1)
- Ho Hos (1)
- Pisces Fish (1)
- microeconomics (1)
- the GPs that B (1)
- Macro 101 (1)
- Micro 101 (1)
- wheat (1)
- chaff (1)
- liberal (1)
- Krugman on Feist (1)
- Why Y? (1)
- The Ps that B (1)
- Bill Gross (1)
- John Paulson (1)
- Allen West (1)
- Pink (1)
- No Doubt (1)
- Justin Bieber (1)
- Marco Rubio (1)
- Psy (1)
- sleeping well (1)
- Jen Wasson (1)
- Otis (1)
- financial coach (1)
- Example 7 (1)
- Wasson Design (1)
- FHA (1)
- pure advice (1)
- music (1)
- Ess Eff See A (1)
- Sula (1)
- my folks (1)
- vibrating air (1)
- gravity (1)
- geology (1)
- AMAs (1)
- MTBs (1)
- Rocket Science (1)
- BaTPC (1)
- Lincoln (1)
- M-M-MM (1)
- dentist jokes (1)
- feoffing (1)
- washing your car (1)
- slack-cutting (1)
- forgiveness (1)
- thankfulness (1)
- Michael Parks (1)
- human beings (1)
- it's a cinch (1)
- HPQ (1)
- DELL (1)
- HP (1)
- Hewlett Packard (1)
- Michael Dell (1)
- hockey stick (1)
- Autonomy (1)
- Compaq (1)
- skill (1)
- luck vs. skill (1)
- Sam Alito (1)
- Al Gore (1)
- Andy Card (1)
- Desert Rose (1)
- Bob Edwards (1)
- architects (1)
- Mohamed Atta (1)
- Taliban (1)
- Tora Bora (1)
- Afghanistan (1)
- Waziristan (1)
- Middle East (1)
- Lebanon (1)
- Iran (1)
- Hezbollah (1)
- WTC (1)
- cram-down (1)
- Stanley Kubrick (1)
- war (1)
- Bob Costas (1)
- gun control (1)
- Ted Nugent (1)
- Jovan Belcher (1)
- RCP (1)
- suicide barrier (1)
- Beach Boys (1)
- summer fun (1)
- chicken jokes (1)
- Jason Whitlock (1)
- Kansas City (1)
- Dog-Eat-Dog (1)
- life's last (1)
- Top Dog (1)
- easily deadly (1)
- YOYODED (1)
- Laura Clawson (1)
- Daily Kos (1)
- Rod Stewart (1)
- B2B (1)
- capital vs labor (1)
- labor vs capital (1)
- pix (1)
- Robert Brusca (1)
- CNN (1)
- CNNMoney (1)
- Chris Isidore (1)
- Wizard of Oz (1)
- Tin Man (1)
- Ted Waitt (1)
- Gateway (1)
- Jerry Brown (1)
- Keystone-Cop’y (1)
- Messrs. H and P (1)
- David Packard (1)
- Bill Hewlett (1)
- Mrs. Robinson (1)
- Morgan Housel (1)
- Motley Fool (1)
- instant grat (1)
- Washington D.C. (1)
- people-kind (1)
- values-added-in (1)
- 1040 (1)
- ink-blots (1)
- National Mall (1)
- White House (1)
- Bigfoot (1)
- Sasquatch (1)
- RAC world. (1)
- Roman Polanski (1)
- Macbeth (1)
- Out Damn Spot (1)
- financial models (1)
- SOL (1)
- Ps2B (1)
- 30-somethings (1)
- RAC (1)
- Ps-that-B (1)
- heal thyself (1)
- Tip O'Neill (1)
- for Pete's sake (1)
- Apple's cash (1)
- Lionel Richie (1)
- All Night Long (1)
- lock-in (1)
- mommy-van (1)
- Big Four Banks (1)
- credit unions (1)
- MBA-brain (1)
- Mom and Pop (1)
- Eric Clapton (1)
- 12/12/12 Concert (1)
- ESPP accounts (1)
- vessels (1)
- TTAs (1)
- OIGs (1)
- M. Scott Peck (1)
- Herman Cain (1)
- shucky ducky (1)
- Uncle Sam (1)
- tax-code-ese (1)
- carried interest (1)
- tax-rate-risk (1)
- Fab (1)
- When We Was Fab (1)
- Jeff Beck (1)
- amortizing (1)
- spread (1)
- 30-year mortgage (1)
- fully-amortizing (1)
- Paul Rogers (1)
- reactive death (1)
- proactive death (1)
- onco death (1)
- The Godfather (1)
- Sting (1)
- Roberta Flack (1)
- In My Life (1)
- Trent Raznor (1)
- Hurt (1)
- Nine Inch Nails (1)
- Rick Rubin (1)
- I Hung My Head (1)
- Sandy Hook (1)
- gallows (1)
- head-hanging (1)
- LLC (1)
- Ari Fleischer (1)
- R&D tax credit (1)
- Portland Oregon (1)
- Muni bonds (1)
- tax-goading (1)
- filibusters (1)
- ATRA (1)
- James Stewart (1)
- Frank Capra (1)
- Byrd Rule (1)
- EGTRRA (1)
- Tax Relief (1)
- 9/11/01 (1)
- TRUIRJCA (1)
- Gerard Depardieu (1)
- France (1)
- Russia (1)
- da mo' da betta' (1)
- Beatles (1)
- boundary event (1)
- Cleaver Family (1)
- Friedman Family (1)
- DNA (1)
- family stuff (1)
- eleventy (1)
- twelvety (1)
- J.R.R. Tolkien (1)
- The Who (1)
- long life (1)
- despising-lobby (1)
- RMDs (1)
- MRDs (1)
- FinancialWonks (1)
- F-Wonks (1)
- fwonks (1)
- TTDAs (1)
- RMDs vs. MRDs (1)
- MRDs vs. RMDs (1)
- the hard way (1)
- J.K. Rowling (1)
- leap days (1)
- scalars (1)
- SBUX (1)
- Starbucks (1)
- Lee Eisenberg (1)
- The Number (1)
- nest egg (1)
- Atrios (1)
- USA Today (1)
- Duncan Black (1)
- Eschaton (1)
- DB vs. DC (1)
- DC vs. DB (1)
- Oldsmobile (1)
- private accounts (1)
- DCs (1)
- DBs (1)
- chained CPI (1)
- Bernie Sanders (1)
- B-2-C dosey doe (1)
- lickety-split (1)
- portmanteau (1)
- Carole King (1)
- Eddie Haskell (1)
- June Cleaver (1)
- TBTF Banks (1)
- 2B2F (1)
- Citibank (1)
- Wells Fargo (1)
- BCCW Cartel (1)
- Fargo (1)
- Coen Brothers (1)
- Marge Gunderson (1)
- money supply (1)
- M1 (1)
- M2 (1)
- ya bet'ch'ya (1)
- you bet'ch'ya (1)
- price fixing (1)
- signaling (1)
- The Atlantic (1)
- Franz Kafka (1)
- rant (1)
- PITB expense (1)
- Kaiser (1)
- pooling risk (1)
- murder mysteries (1)
- high deductibles (1)
- Rip Van Winkling (1)
- asset gathers (1)
- Brylcreem (1)
- careful boss (1)
- precommitment (1)
- spending's reach (1)
- Suzy Khimm (1)
- Sequester (the) (1)
- Scott Galupo (1)
- Larry Kudlow (1)
- CNBC (1)
- Forbes magazine (1)
- yada yada yada (1)
- GHP (1)
- On and On (1)
- Stephen Bishop (1)
- CNBC.com (1)
- crowding out (1)
- The Economist (1)
- pension plans (1)
- take a powder (1)
- Roth conversions (1)
- shine it on (1)
- brain trust (1)
- roll-overs (1)
- mindfulness (1)
- bar dice (1)
- MindfulFinancial (1)
- making a living (1)
- brain trust'ees (1)
- do right by (1)
- Wiktionary (1)
- Bing Crosby (1)
- Romper Room (1)
- The Secret (1)
- Stanley Tucci (1)
- texting (1)
- Paul Bettany (1)
- Bob Marley (1)
- OIALTO (1)
- Oy ALto (1)
- Golden Rule (1)
- Charles Dickens (1)
- remodels (1)
- pets (1)
- dogs (1)
- veterinarian (1)
- BMW (1)
- Mercedes (1)
- CPA'y (1)
- spendthrift (1)
- sanguine (1)
- peruse (1)
- pets (cost of) (1)
- thrift shops (1)
- Steve Wonder (1)
- Elvis Presley (1)
- Mandy Patinkin (1)
- cats (1)
- cash-suck (1)
- kids (cost of) (1)
- San Rancisco (1)
- used car values (1)
- Kelley Blue Book (1)
- tax basis (1)
- rainy days (1)
- meta-don't (1)
- Seth MacFarlane (1)
- David Crosby (1)
- Fox News (1)
- Ben Affleck (1)
- marriage is work (1)
- Left Coast (1)
- Right Coast (1)
- gender politics (1)
- Ernest Hemingway (1)
- Tom Robbins (1)
- quiet rooms (1)
- Phoenix Books (1)
- Scarface (1)
- Compliance (1)
- Ayn Rand (1)
- Harold Robbins (1)
- Danielle Steel (1)
- Edward Tufte (1)
- PowerPoint (1)
- big cheese (the) (1)
- Cannes (1)
- WAG numbers (1)
- .xls (1)
- Form ADV-II (1)
- turnip blood (1)
- not equal to (1)
- greater than (1)
- less than (1)
- Hartford CT (1)
- Star Wars (1)
- mind-trick (1)
- mind-meld (1)
- economic rents (1)
- The Golden Rule (1)
- hippies (1)
- magic 7s (1)
- Jimmy McMillan (1)
- CCCs (1)
- hippie days (1)
- magic tricks (1)
- magicians (1)
- killing the 7s (1)
- Christpher Nolan (1)
- Batman Begins (1)
- The Dark Knight (1)
- Gran Torino (1)
- get off my lawn (1)
- no problem (1)
- you're welcome (1)
- thank YOU (1)
- customer service (1)
- CRM (1)
- Sacramento (1)
- Rancho Santa Fe (1)
- Pleistocene Era (1)
- VOIP (1)
- EFP (1)
- datadump (1)
- bifurc (1)
- garbage dumps (1)
- Ps that Be (1)
- batphone (1)
- Polycom (1)
- permutations (1)
- iterations (1)
- combinations (1)
- Lake Cook Road (1)
- Skokie Highway (1)
- Scott (1)
- Doug (1)
- Marty (1)
- snow fight (1)
- The Pretenders (1)
- Chrissie Hynde (1)
- My City was Gone (1)
- macro class (1)
- Andrew Rose (1)
- Greg Mankiw (1)
- MBA-types (1)
- DIY EPers (1)
- Dixie Chicks (1)
- Hoyt Axton (1)
- No No Song (the) (1)
- know-it-all (1)
- Cliff Clavin (1)
- Cheers (TV show) (1)
- zero lower bound (1)
- Ivan Pavlov (1)
- B.F. Skinner (1)
- signal and noise (1)
- signal (1)
- noise (1)
- noise and signal (1)
- Bat Chain Puller (1)
- French TV (1)
- Bobby McFerrin (1)
- acapella (1)
- Snagglepuss (1)
- Intuit (1)
- TurboTax (1)
- Mint.com (1)
- budgeting (1)
- budget (1)
- b-word (the) (1)
- Morningstar (1)
- Ibbotson (1)
- SCHZ (1)
- SWLBX (1)
- VBMFX (1)
- Lehman Brothers (1)
- Chuck (Schwab) (1)
- Talk to Chuck (1)
- Hollies (the) (1)
- ponies (1)
- piggy bank (1)
- Amazon (1)
- Andrew Sullivan (1)
- bottlenecks (1)
- Gavin Newsom (1)
- Andew Sullivan (1)
- Radiohead (1)
- In Rainbow (1)
- Henrietta Lacks (1)
- HeLa cells (1)
- Gollum (1)
- my precious (1)
- Boiler Room (1)
- paywall (1)
- Washington Post (1)
- Dataligix (1)
- Epsilon (1)
- Axciom (1)
- Mark Wahlberg (1)
- Marky Mark (1)
- Mark Zuckerberg (1)
- Trojan Horse (1)
- DRE (1)
- life agent (1)
- contractors (1)
- realtors (1)
- Mr. McGuire (1)
- The Graduate (1)
- plastics (1)
- Eddie Arnold (1)
- SEO (1)
- Wikipedia (1)
- dogwalkers (1)
- UFO guy (1)
- SEO'y (1)
- TBToIBI (1)
- TBFoIBIA (1)
- Hindenberg (1)
- Gordon Gekko (1)
- probate (1)
- living trusts (1)
- revocable trusts (1)
- Napoleonic Code (1)
- Edwin Starr (1)
- lipsynching (1)
- War (song) (1)
- Louisiana (1)
- probate court (1)
- probate process (1)
- gift tax (1)
- CUSIP (1)
- NWUM fees (1)
- Bud Fox (1)
- magic dollars (1)
- Charlie Sheen (1)
- hourly fees (1)
- flat fees (1)
- passive voice (1)
- FRED charts (1)
- bear markets (1)
- Vladmir Putin (1)
- Richard Thompson (1)
- Linda Thompson (1)
- Information Week (1)
- Windows Vista (1)
- Windows 8 (1)
- WIndows XP (1)
- Marc Andreessen (1)
- Ameritrade (1)
- Datek. (1)
- DIY investing (1)
- Spiders (1)
- Qs (1)
- Wall Strret (1)
- day trading (1)
- hospice care (1)
- Guy Murchie (1)
- Joel R.Primack (1)
- sound of cicadas (1)
- cicadas (1)
- Jake Scully (1)
- Avatar (movie) (1)
- tall people (1)
- zeros (1)
- gladiating (1)
- Keystone Cops (1)
- FUBAR (1)
- SNAFU (1)
- medical journey (1)
- C corp (1)
- S corp (1)
- self-employment (1)
- say no more (1)
- U.S. Treasury (1)
- debt default (1)
- Stan Collender (1)
- Bruce Bartlett (1)
- lumpy revs (1)
- line of credit (1)
- Californa (1)
- Balance Sheet (1)
- Income Statement (1)
- Gene Simmons (1)
- lumpy revenues (1)
- predict (1)
- pre-dict (1)
- post-dict (1)
- Karl Rove (1)
- Ess Eff (1)
- hockey (1)
- mortgage rates (1)
- triangular lots (1)
- scale tales (1)
- Twitter IPO (1)
- Mexican Museum (1)
- Four Seasons (1)
- Socket Site (1)
- what-if'ing (1)
- maths (1)
- arithmetic (1)
- round numbers (1)
- linearity (1)
- Oliver Twist (1)
- No soup for you! (1)
- too much money (1)
- Jason Hull (1)
- Dr. McCoy (1)
- FAFNF (1)
- AUM (1)
- Motortrend (1)
- > (1)
- < (1)
- Ferrari (1)
- Isaac Newton (1)
- SF Curbed (1)
- TWTR (1)
- Investopedia (1)
- dutch auctions (1)
- Ferrari FF (1)
- V8 engines (1)
- V12 engines (1)
- IPO scandal (1)
- Tracey (1)
- Stockton (1)
- Vallejo (1)
- Socketsite (1)
- Friendster (1)
- MySpace (1)
- public offering (1)
- bubbles (1)
- 3/20/2000 (1)
- 8/15/2008 (1)
- BIT (1)
- fax machines (1)
- Mosaic browser (1)
- Marc Andreeesen (1)
- Barrows Hall (1)
- UC Berkeley (1)
- Lynx (1)
- 11/11/1993 (1)
- NCSA (1)
- Chambana (1)
- free (1)
- healthcare.gov (1)
- HITECH Act (1)
- ARRA (1)
- Stimulus (the) (1)
- Jennifer Garner (1)
- pre-Mosaic (1)
- Yardbirds (the) (1)
- Beatles (the) (1)
- zeitgeist (1)
- census (1)
- Houston (1)
- Virginia (1)
- zero-sum game (1)
- voting systems (1)
- Rand Paul (1)
- transfat (1)
- systems (1)
- variance (1)
- VA AG (1)
- statistics (1)
- bell curve (1)
- Batkid (1)
- Miles Scott (1)
- Cancer.org (1)
- IBC (1)
- TruthOut (1)
- Medi-Cal (1)
- Zuccotti Park (1)
- Occupy (1)
- Occupy movement (1)
- Batman kapow (1)
- 401k match (1)
- vesting (1)
- FPL (1)
- mulitplier (1)
- stimulus (1)
- Nick Gillespie (1)
- Reason.com (1)
- free money (1)
- Effie Trinket (1)
- steps per mile (1)
- petri dish (1)
- pertussis (1)
- whooping cough (1)
- match patch (1)
- Whole Life (1)
- Univeral Life (1)
- language fail (1)
- Taylor Swift (1)
- Alabama Shakes (1)
- Letterman (1)
- Hold On (song) (1)
- 4% Rule of Thumb (1)
- 6% Rule of Thumb (1)
- Rolling Stones (1)
- Joe McConnell (1)
- Sunol Grade (1)
- lemmings (1)
- oil wildcatting (1)
- Fugs (the) (1)
- George Clooney (1)
- monkey brain (1)
- Stevie Winder (1)
- Hogan's Heroes (1)
- drought of 2013 (1)
- Mont (1)
- collectibles (1)
- 49ers (1)
- smartned-up (1)
- Panthers (1)
- KISaSSYPGE (1)
- Punditracker (1)
- Big Four (the) (1)
- Titanic (move) (1)
- Jim Cramer (1)
- snake oil (1)
- Samsung (1)
- Tesla (1)
- financial media (1)
- iPhone 5C (1)
- iPhone 5s (1)
- football (1)
- Seattle Seahawks (1)
- Richard Sherman (1)
- Superbowl (1)
- violence (1)
- Peggy Lee (1)
- Geritol (1)
- job-lock (1)
- google bus (1)
- technology (1)
- indoor plumbing (1)
- Internet (1)
- fish gotta swim (1)
- ejection seat (1)
- Aston Martin (1)
- Sean Connery (1)
- Aston Martin DB5 (1)
- job unlock (1)
- a cappella (1)
- human capital (1)
- stress (1)
- bee's knees (1)
- Clint Black (1)
- Anya Schiffrin (1)
- Craig Kilborn (1)
- Cancer Institute (1)
- cancer staging (1)
- Paris (1)
- Andre Schiffrin (1)
- Manhattan (1)
- value-detract (1)
- Homer Simpson (1)
- Medicare Part C (1)
- Medicare Part A (1)
- Medicare Part B (1)
- jungle lasso (1)
- Sherrod Brown (1)
- Medicare for All (1)
- death tax (1)
- SOI (1)
- FPA (1)
- FPA SF (1)
- estate planners (1)
- appraisers (1)
- Karen Valentine (1)
- Austin Powers (1)
- oh behave! (1)
- Tucson Arizona (1)
- x axis (1)
- COD (1)
- Rush Limbaugh (1)
- EIB Network (1)
- Peter Fisher (1)
- AM960 (1)
- Felix Salmon (1)
- Slate (1)
- Michael Lewis (1)
- Flash Boys (1)
- GNH (1)
- Rush Revere (1)
- rushlimbaugh.com (1)
- NIMH (1)
- ADHD (1)
- Sandra Fluke (1)
- TheBigUs.com (1)
- Big Us (The) (1)
- CYA (1)
- legalese (1)
- boilerplate (1)
- hyper-fast-talk (1)
- FSIC (the) (1)
- asbestos (1)
- cancer (1)
- Pablo Picasso (1)
- HIPAA releases (1)
- CSW (1)
- holographic will (1)
- wills (1)
- trusts (1)
- living wills (1)
- Nolo Press (1)
- Maine (1)
- Michigan (1)
- New Mexico (1)
- Wisconsin (1)
- executors (1)
- guardians (1)
- bond (surety) (1)
- surety bond (1)
- Bali (1)
- deadlines (1)
- pre-commitment (1)
- Bullmastiffs (1)
- proximate cause (1)
- Basset Hounds (1)
- Saint Bernards (1)
- spam-evildoers (1)
- spambots (1)
- Alan Goldfarb (1)
- fee-based (1)
- fee-only (1)
- FP'er (1)
- business models (1)
- plumbers (1)
- shoes (1)
- shoe salespeople (1)
- insurance (1)
- vigs (1)
- vigging (1)
- ownership (1)
- cake-eating (1)
- vigorish (1)
- King of Assets (1)
- Queen of Assets (1)
- -Onlies (1)
- -Baseds (1)
- ALEC (1)
- LUST (1)
- Magnum P.I. (1)
- P.I. lawyers (1)
- whiplash (1)
- malingerers (1)
- totaled car (1)
- Hartford (1)
- Kelly Blue Book (1)
- KBB (1)
- Edmunds (1)
- NADA (1)
- cars (1)
- automobiles (1)
- Scorpion (1)
- scrap value (1)
- Michael Jackson (1)
- Diana Ross (1)
- Quincy Jones (1)
- Rover 2000TC (1)
- P.I. law (1)
- trade rag (1)
- trade magazine (1)
- trade mag (1)
- Rupert-Murdoch (1)
- Financial Times (1)
- Antwerp flashmob (1)
- Julie Andrews (1)
- Do Re Mi (song) (1)
- Sound of Music (1)
- Merriam Webster (1)
- bollix (1)
- hotchpot (1)
- punctilio (1)
- fightin' words (1)
- MS-DOS (1)
- Murdochian (1)
- IBD (1)
- Sire Pukes-A-Lot (1)
- TLAs (1)
- FP50IBD (1)
- WFs (1)
- Full Monty (1)
- churning (1)
- reverse churning (1)
- stockbrokers (1)
- stockbrokerages (1)
- Point A (1)
- Point B (1)
- DOS (1)
- wealthy folks (1)
- generalists (1)
- Google Machine (1)
- RIA (1)
- RIA-land (1)
- flashmob (1)
- Mark Knopfler (1)
- Wembley (1)
- Louis Armstong (1)
- Enron (1)
- Enron 401k plan (1)
- Janus funds (1)
- SMB market (1)
- handsome ransome (1)
- U.S. Congress (1)
- Carl Levin (1)
- Daniel Sparks (1)
- Timberwolf I (1)
- shitty deal (1)
- Goldman Sachs (1)
- rotten deal (1)
- CDOs (1)
- derivatives (1)
- Bogleheads (1)
- Solo 401k Plan (1)
- i401k plan (1)
- NGO (1)
- NGO'ed (1)
- Boomtown Rats (1)
- Bob Geldof (1)
- LiveAid 1985 (1)
- Aragorn (1)
- The Black Gate (1)
- bliss ninny (1)
- mortality (1)
- Romeo and Juliet (1)
- Comcast (1)
- AT&T (1)
- Verizon (1)
- SBC (1)
- PacBell (1)
- email addresses (1)
- nemesis (1)
- IT department (1)
- Yahoo! (1)
- gmail (1)
- Yahoo! Mail (1)
- Shades of Grey (1)
- true-dat (1)
- Internet domains (1)
- domination (1)
- email spoofing (1)
- spoofing (1)
- spam (1)
- database design (1)
- air-quotes (1)
- free advice (1)
- grace-provider (1)
- very-scary (1)
- luck of the draw (1)
- Brochures (1)
- SLN (1)
- Monterey CA (1)
- genie wishes (1)
- grin (1)
- MSK (1)
- friction (1)
- paperwork (1)
- New York (1)
- NYC (1)
- complexity (1)
- larding-up (1)
- private equity (1)
- speech therapy (1)
- physical therapy (1)
- gym class (1)
- parents (1)
- Will Robinson (1)
- Lost in Space (1)
- gym (1)
- PE class (1)
- Lisa Loeb (1)
- Stay (song) (1)
- beeps (1)
- bips (1)
- the Fed (1)
- AMT (1)
- Gretchen Wilson (1)
- country music (1)
- ton of tons (1)
- sunsetting (1)
- visibility (1)
- income averaging (1)
- tax shelters (1)
- lumpy income (1)
- tax fairness (1)
- tax complexity (1)
- tears (1)
- Bob Dylan (1)
- tears upon death (1)
- caregivers (1)
- mortal plane (1)
- midnight (1)
- 12:01 a.m. (1)
- dying moment (1)
- moment of dying (1)
- death tears (1)
- Goldilocks (1)
- Google Sheets (1)
- pricing theories (1)
- Google Suite (1)
- GOOG vs MSFT (1)
- magic numbers (1)
- MSFT vs GOOG (1)
- nit (1)
- gnat (1)
- Black Swan (1)
- Lehman Bros. (1)
- This Old Dog (1)
- NDIC (1)
- Bay Area (1)
- Italy (1)
- oil prices (1)
- piker (1)
- chalk line (1)
Black Monday 2020: the Stock Market Backtracks to 2017
Monday, March 9, 2020 at 3pmBy John Friedman
Well, that happened, and by that I mean a black swan sort of a day, a day living in the same general neighborhood as September the 15th, 2008 (the worst day of the worst financial crisis since the Great Depression) and September the 17th, 2001 (the day the stock market first opened for trading following 9/11). And let’s not pooh-pooh the 22.6% single-day swan-dive-into-a-belly-flop the Dow 30 did on Black Monday — that would be the 1987 Black Monday, not the one we just experienced, which we’ll probably end up calling the 2020 Black Monday — which makes today’s sub-8% drop look like a wee piker. I remember it well . . .
Today was a day in which, among other things, the Russians and the Saudis decided to really screw with each other over the price of oil (the good news: getting those two to kiss and make up and just all get along is something the current administration should be not-terrible at). It was also a day when people living in a portion of Northern Italy representing one quarter of Italy’s landmass — which is a lot, but it’s even more when you consider that the people living in those areas generate two-thirds of Italy’s economic output — was in quarantine. And making it all so very, very much worse, it was also a day when the worst president of all time continued to make light of the unfolding epidemic and continued to let us know, in so, so many words and actions, that he really doesn’t want to test people for the virus because that would make him look bad.
But I digress. I’m here to talk stocks ‘n bonds and such and, more specifically, Friedman’s Law of the Backtrack.
* * *
One of the very best ways to judge the severity of a stock market downdraft following a generally up-trending market is to figure out the “backtrack” — that is, how long ago was the earliest point in time that the stock market first reached the levels the downdraft is reprising?
The answer to that question today is December of 2017. That’s the first time you could have bought into (or sold out of) the American stock market at a pricing level similar to today. So, if you ignore dividends (the cashflow that a stock portfolio generates) and look only at prices of stocks themselves, everything that happened in the stock market from 12/2017 until 3/9/2020 has pretty much amounted to a hill of beans . . . flattened by an ocean liner anchored off the coast of the Bay Area, full of people whiling away the hours while sitting in quarantine.
Picture it this way: if you had thought about buying into the market in December of 2017 but didn’t, and have regretted it ever since as you watched the market climb climb climb, regret no further because the market has retraced itself all the way back to that level and you can now do what you regretted not doing way back then.
To just go there, feast your eyes on this five-year chart of VTI, which is Vanguard’s Total Stock Market fund in its Exchange Traded Fund wrapper:
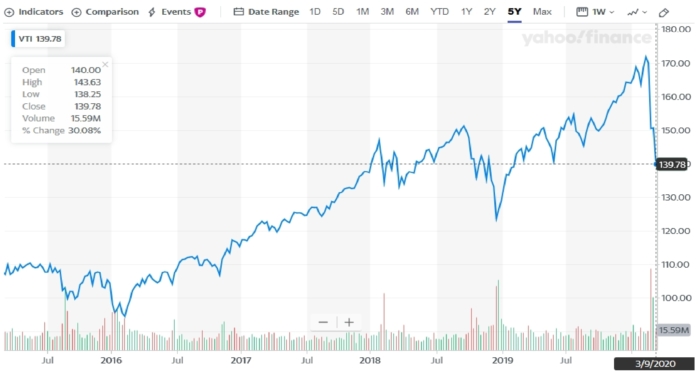
So you see those faint vertical gray shadings alternating with similar white shadings (or vice versa, depending on how you see things) (oo-wee-oo)? They represent six-month chunks of the calendar. And you see the blue squiggly line? That represents the closing daily prices of VTI shares for the past five years — from considerably less than $100 in early 2016 to more than $170 about three weeks ago.
I chose VTI here because it serves as the most fundamental of all building blocks for people investing in stocks in America because VTI, in a very sophisticated but outwardly quite simple way, represents the entire American stock, and it does so proportionally, so, if, e.g., the value of all shares of Apple stock equals 4% of the value of all publicly traded stocks in the American stock market, then 4% of the portfolio of VTI would be invested in AAPL shares, etc.
And you see that horizontal dotted line? I snapped that, chalk-line like, with my mouse, and did my utmost to make sure that the right-most part of the dotted line would intersect today’s price of VTI just a few minutes shy of the end of the day. As it happened, that line is at $139.78, and the last price for VTI today was $138.50, so the line is actually a bit higher than the price of VTI at the close of the market at 4pm Eastern/1pm Pacific (yup, it was so ugly a day in the markets that the last five minutes served to add insult to the already quite egregious injury).
And you see the leftmost point where that blue line and the horizontal dashed line touch? It looks like it’s right around 12/31/2017 or 1/2/2018. But I went ahead and looked up the intraday prices of VTI in late 2017 and it turns out VTI had an intraday high price (as opposed to the closing prices shown in the chart) on December 18, 2017 of $138.68 — a bit more than a bit higher than the close today.
And that’s the answer to the backtrack question: the American stock market has backtracked a few days less than two and a quarter years, and is (un) partying like it’s the Monday a week before Xmas during the 2017 holiday season. I remember it well . . .
Given that this is 2020, that kinda sounds something like three years. You know what else has been going on for something like three years?
* * *
Two last things:
First, yes, I did expand two and a quarter years into three years and added in an implication about something that’s been going on for about three years and a couple of months (or a bit more than three years and four months, depending on how you count). Fluffing up numbers is appropriate given the aim of my fluffing, who, among other chiefly things, is the NDIC — the Numbers-Distorter-in-Chief.
Second, don’t @t me for using Yahoo Finance. In the early days of the Internet, when dinosaurs roamed the earth and the Internet was almost purely a force for good, Yahoo Finance was totally great for grabbing charts, so it’s where I built up my charting chops. Admittedly it hasn’t been great at that for years, but it still does a better job than other charting tools — for me anyway (and did I mention that This Old Dog is one of my favorite TV shows?).
o5fuk6
ukknv0